The numbers exist.
Just not on one screen.
For companies where the monthly overview means an afternoon of exporting and pasting. Your revenue sits in your bookkeeping, your planning in another tool and your hours in a third. A custom dashboard pulls those three together into one screen that is correct every morning. From € 1,450, with a fixed price after one call.
Why reporting keeps slipping.
A day a month exporting
Pull numbers from three systems, paste them into a spreadsheet, check, format. Every month again, and by the time it is ready it is about last month.
Nobody trusts the number
Two people calculate the same thing and get different answers, because they used a different filter or period. Then the meeting is about the source instead of the outcome.
Standard reporting almost fits
Your package has reports, but not the breakdown you need: per project type, per engineer, per margin instead of revenue.
Only you can get at it
The numbers sit in accounts your team cannot access, so every question lands with you.
You steer after the fact
In March you see that February was bad. What you need is to see the pattern while you can still do something about it.
A BI tool nobody used
Somewhere there is a Power BI or Looker environment nobody opened after two months, because it wanted to show too much and answered too little.
From separate exports to one screen.
Which decision does it support
Not which charts you want, but which question you ask every week and what you do with the answer. A dashboard that changes no decision does not get used.
Collecting the sources
Bookkeeping, planning, webshop, stock, time tracking. Anything with an API or export comes in; anything without one we name before something gets built.
One definition per number
What counts as revenue, does a quote count or only an order, when is a project finished. Those definitions go into the code, so everyone sees the same number.
Rolling out with the people using it
One team first, then the rest. Permissions per role, so an engineer sees their own numbers and management sees the total.
- ✓One screen with numbers from all your systems
- ✓Definitions fixed in code instead of in heads
- ✓Updated daily without manual work
- ✓Permissions per role or per team
- ✓Works on a phone and on a screen in the canteen
- ✓Repository and hosting in your name
The number of data sources to unlock drives the number, not the number of charts.
The price depends on the number of sources and how many calculation rules are involved, not on the number of charts. After a half-hour call you get a fixed price.
First check whether a BI tool will do
Power BI, Looker Studio and Metabase are good at what they do and cost a fraction of custom work. If your data sits in one or two systems with a clean connection and you mainly want charts, that is the sensible route and I will say so.
Custom starts to pay off at three moments: when your company's calculation rules do not fit a standard formula, when the dashboard has to do more than show, or when the people who need it have no BI licence.
Your own calculation rules
Margin per project type, utilisation per engineer, turnover per season. Formulas that only work this way at your company and that you do not want to recompute every month.
More than looking
Approving an order, updating a status or sending a reminder straight from the screen. A reporting tool cannot do that, and it is exactly where daily use comes from.
Everyone included
Fifteen people who only need their own numbers, without fifteen licences. Permissions per role instead of per account.
Clients looking in
If your clients need to see their own numbers or project status, it becomes a [client portal](/klantportaal-laten-maken) with a dashboard inside.
What it looks like
This site carries a working demo of exactly this kind of screen: filters, charts and tables reacting the way they do in a real dashboard. Try it on demos before you decide anything; that says more than a screenshot in a quote.
- ✓Numbers from bookkeeping, planning and stock
- ✓One fixed definition per number
- ✓Updated daily or live
- ✓Filters by period, team or project
- ✓Permissions per role
- ✓Export to a spreadsheet if someone insists
What it costs
A dashboard is usually the smallest custom track there is, because no new data appears: you show what already exists. What sets the price is the number of sources and the number of calculation rules involved.
How pricing works is on pricing. If it grows into a system people work in, read on at custom software development. If a spreadsheet still feeds your figures, it can simply stay: you do not have to get rid of Excel.
Overview
Sample data · not real figures
Revenue per month
RevenueOrdersTarget| Month | Revenue | Orders |
|---|---|---|
| Feb | €18,400 | 42 |
| Mar | €21,900 | 51 |
| Apr | €19,700 | 46 |
| May | €24,300 | 58 |
| Jun | €27,800 | 63 |
| Jul | €25,100 | 55 |
| Aug | €22,600 | 49 |
| Sep | €29,400 | 68 |
| Oct | €31,200 | 74 |
| Nov | €35,800 | 86 |
| Dec | €41,300 | 97 |
| Jan | €33,500 | 79 |
Revenue per channel
- Webshop
- €148,90045%
- Quotes
- €92,40028%
- Subscriptions
- €61,30019%
- Marketplaces
- €28,4009%
Everything on this screen comes from one fixed dataset in the page itself. In reality this comes from your database or accounting.
Dashboards in the real world
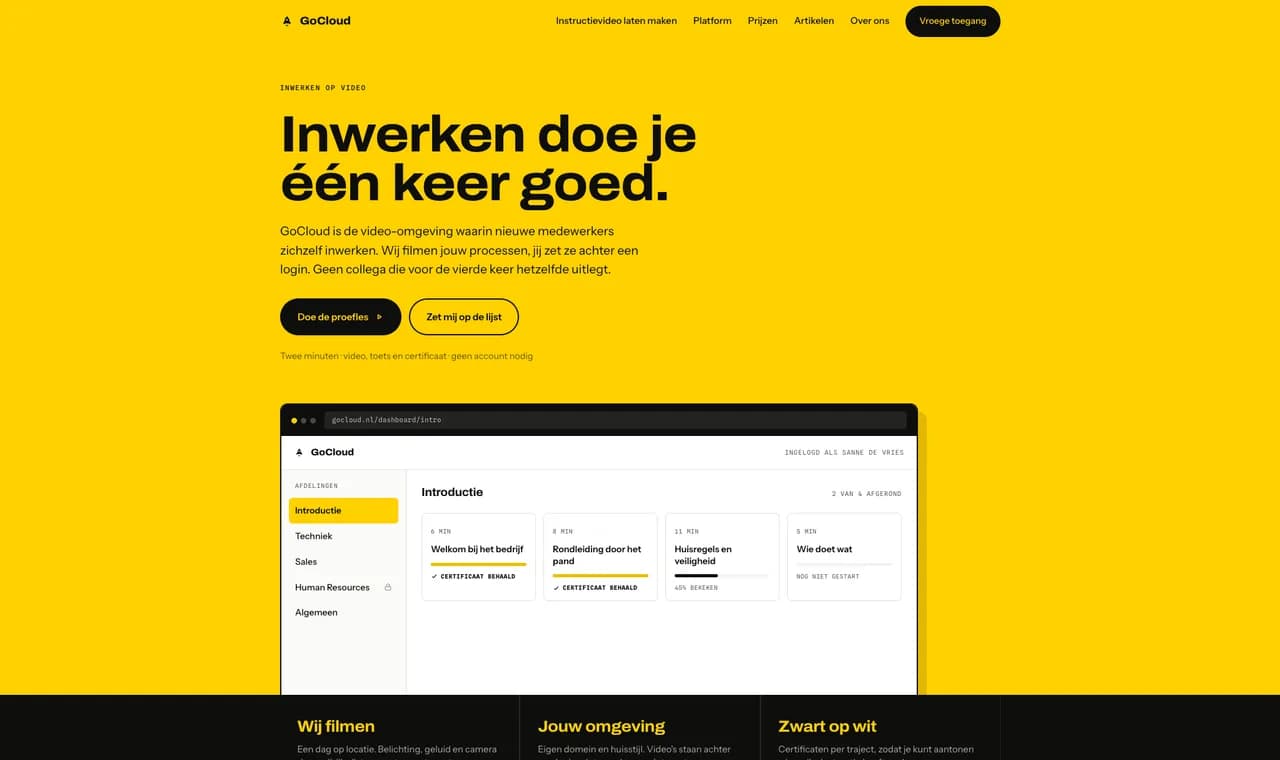
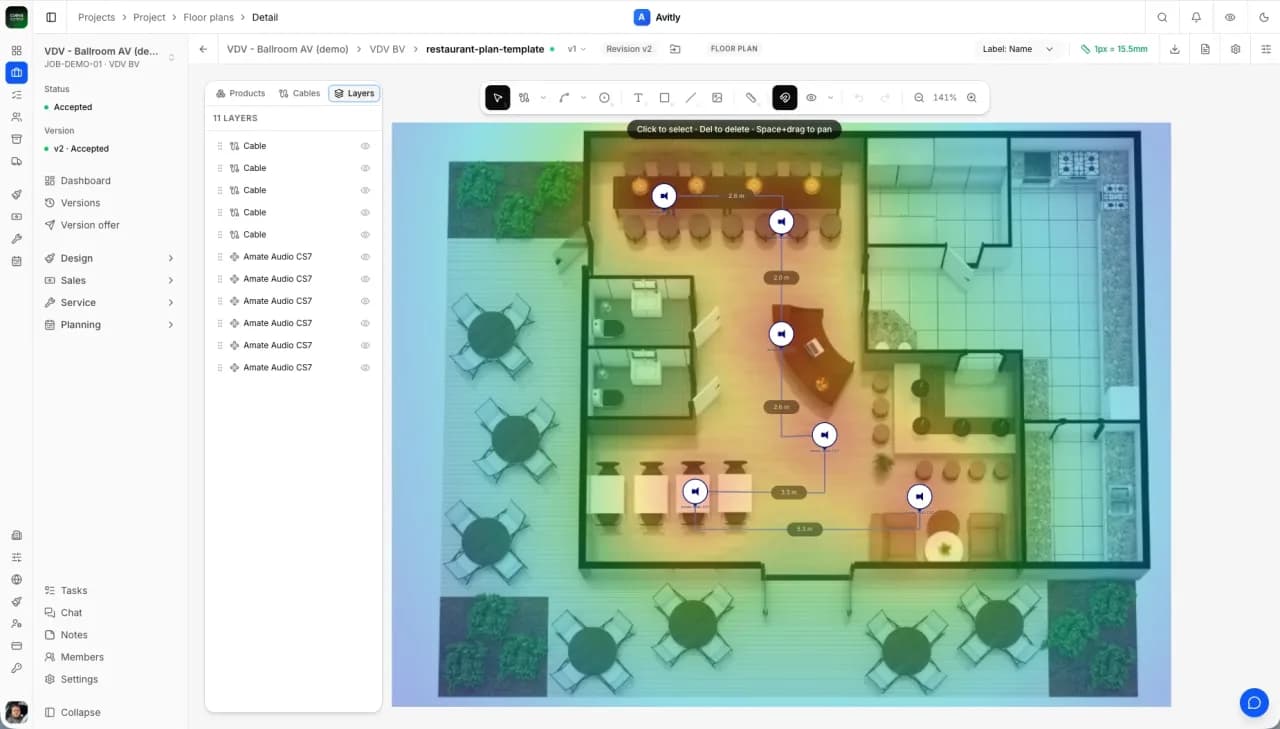
What does a custom dashboard cost?
Which systems can you pull numbers from?
Is Power BI not cheaper?
How often are the numbers updated?
Can staff see only their own numbers?
How long does it take?
Tell me what you
want to build.
A half-hour call. You get an honest answer about what it costs, how long it takes and whether building it is smart at all.